I am very pleased. For years, now, I have striven to develop a clean and simple temperature control algorithm for my coffee machine which gets it to a stable temperature in the minimum possible time. This weekend, I cracked it: two minutes to a stable 95°C on my Gaggia Baby Class with no oscillations at all1That’s not quite all that is needed – the brew head needs bringing up to temperature as well. But that’s a different topic and I’m still working on it. Two minutes is also not an absolute minimum because the boiler power can be increased. Also a topic for another day. For the purposes of this post, we’ll use the stock 1350W the machine shipped with..
This is how I did it…
The preamble you can ignore if you know about PID
The canonical coffee machine temperature control algorithm is PID, or “proportional integral derivative” control. This starts with a simple idea: if the difference between the target temperature and the present temperature is e (for “error”), then we apply an amount of power equal to P × e. (“P” for “proportional” because this aspect of the controller’s output is proportional to the input). The greater the divergence from target temperature, the more power the controller applies. When stable (assuming this is possible), the error will hopefully be fairly small, but just enough to cause maintenance power to be supplied.
There are two great problems with a simple P controller. The first is latency. Any latency in the system will cause oscillations for sufficiently large P values because the controller will apply correcting power for too long (the whole time of the latency), by which time too much energy will have been injected into the system and the temperature will overshoot the mark, where the cycle begins again with too much correcting power in the opposite direction. The only way to get to a stable temperature is to use a small value of P. But this can mean that it takes a very long time to reach stability. And I want coffee now!
The second problem is power loss. Any real-world coffee machine leaks heat to the surrounding air. If the rate of loss is L, then P × e = L when the system is stable so there must always be a temperature error of e = L / P. For large enough values of P, the error can be made arbitrarily small. But, hang on, we can’t make P arbitrarily large because of the problem with oscillations!
The first of these problems can be mitigated somewhat if we look ahead to the future. If we measure not just the error e, but also the rate of change of the error e’, then we can guess what e will be after the latency period by adding some multiple (let’s call it “M”) of e’ to e. So now power is P × (e + M × e’). Or, let’s collapse that by introducing the “derivative” coefficient D, which gives a power of P × e + D × e’ where D = P × M.
Sadly measurement noise messes up the D component. Any noise will give false values for e’. And it’s difficult not to have at least some noise.
Finally, the fixed-offset error could, perhaps, be mitigated by maintaining a total of the error over time, i.e. the time integral of the error. Let’s call this integral E. If we apply a coefficient I to E, then over time any fixed-offset error will accumulate in E and the gap will slowly close. So the total PID controller applies power P × e + I × E + D × e’. Hence “PID”.
This would be lovely, except the I component of the controller also introduces oscillations and so the I coefficient also needs to be quite small and so, once again, it takes forever to get to a stable temperature and my coffee thirst is not abating!
So people who implement PID controllers end up tweaking them endlessly. There must be a better way.
PID on the Gaggia Baby Class
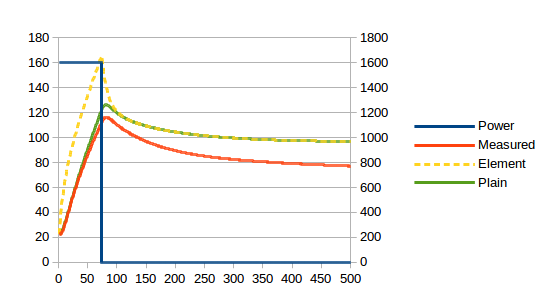
Here’s a graph of what happens if you run the Baby Class up to 110°C at full power and then switch the heating elements off (power is on the right y-axis):
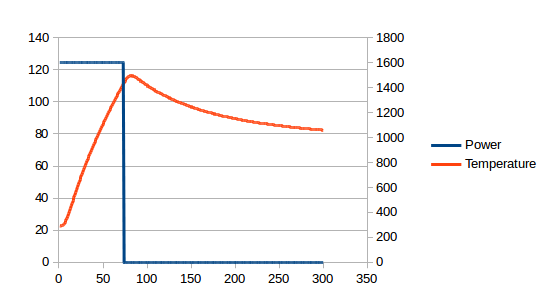
The latency is clear: it takes about 10 seconds for the temperature curve to fully respond to the discontinuities in the power curve2Bother! Having slaved over this graph, I now notice I used 1600W and I had promised to stay at 1350W. I can, however, assure you that the same latency occurs with the stock boiler.. I have spent years trying to work around this. [Edit: I later found a better way of mounting the temperature probe and this latency decreased, but it was still there.]
The latency means we must have small values for P, I and D, which means that the power applied to get a stable temperature has to be varied very slowly over time. The whole section between about 50s and 170s below is just waiting time. And I even pushed the P coefficient so we do get a little bit of oscillation3In the interests of clarity, the two graphs below are taken from simulations rather than a real coffee machine. This allows me to simplify the presentation by removing effects that are not germane to the present conversation.:
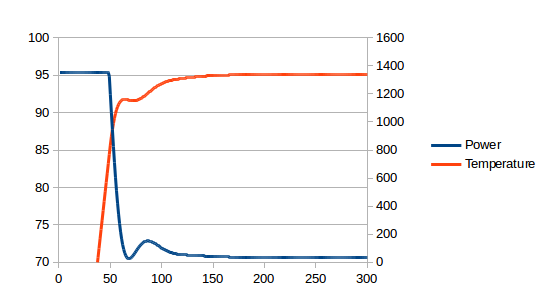
The ideal controller, on the other hand, would apply full power for some period and then immediately switch to maintenance power at exactly the right moment. i.e. the stable temperature would be approached very quickly4The smooth tailing-off of the power between 60s and 100s is caused by power loss to other components of the system which are still warming up rather than the controller approaching the target power slowly..
The eureka moment(s)
What if there were no latency? Then the P value could be really large without causing oscillations, so there would be no need for the D component of the controller, and the fixed-offset error would be really small so there would be no need for the I component of the controller and the controller would be very reactive, so the system would stabilise really quickly.
So, what if, instead of applying a PID controller to the measured temperature, we apply just a P controller to a digitally modelled temperature that responds immediately to changes in power? This would work perfectly. Well, perfectly with one (critical) down-side: no model is perfect, so the model will diverge from reality resulting in bad coffee at best and an explosion at worst5How hot would the boiler need to get to explode? Well, we know it can handle at least the 15 bar the pump generates, so (quickly checking steam tables) you’d need well over 200°C. The silicone O-ring will still be safe at this temperature but the thermal fuse ought to have blown. Still, I think, for the sake of rhetoric, we can count a blown fuse as a small explosion!. So we have to somehow incorporate real-world temperature measurements into our model.
How to do this? I’ll spare you the years of tinkering and jump to what works. There are two sides of the boiler shell that contain heating elements and two plain sides. My temperature sensor is placed one of the plain sides. Let’s try splitting the shell into two components, the plain sides and the element sides, and then model heat transfer between the two. For this we need to stop controlling for temperature and start controlling for total energy. I’ve measured a lot of important physical parameters of the machine so I know the boiler shell has a heat capacity of 549 J/K. Splitting this evenly between element sides and plain sides and picking a suitable heat transfer coefficient (let’s pick 14 W/K out the air – and I’ll explain this number later), the real world graph at the top now compares to the model as follows:
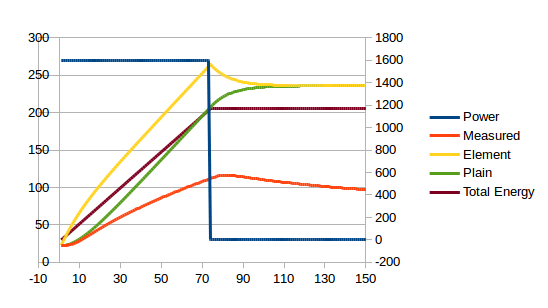
The red and green lines diverge significantly, so we still have some work to do, but, critically, both lines display the same latency. But, as can be seen from the (not to scale) brown line, the total energy has no latency and would be perfect for a P controller!
The divergence between the red and green lines represents two factors. One is the energy which goes into the water, brew head and general body of the machine. This is what causes the red line to curve upwards from about 100s onwards as these elements warm up and use progressively less power. The other is the loss to the atmosphere which, being big and full of convection currents, never gets warmer6By any measurable amount anyway!. This causes the asymptotic slope towards which the red line trends. The green line knows nothing of these things, but it needs to.
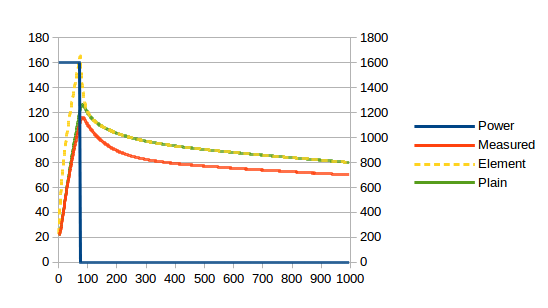
In principle, I think we could probably lump the water, brew head and body into one thermal mass, but I don’t want to do that because I would actually like to know what the water and brew head temperatures are. It’s all very well knowing how hot the shell is – but it’s water that brews coffee and the water has to pass through the brew head. So, let’s start with the water which, by my measurements, has a heat capacity of 422 J/K. The brew head has a heat capacity of 616 J/K. I have measured the heat transfer coefficient from the boiler shell to the brew head at 3.6 W/K. We’ll assume both parts of the boiler shell have the same (unknown but we’ll pick something suitable) heat transfer coefficient to the water. This is what we get:
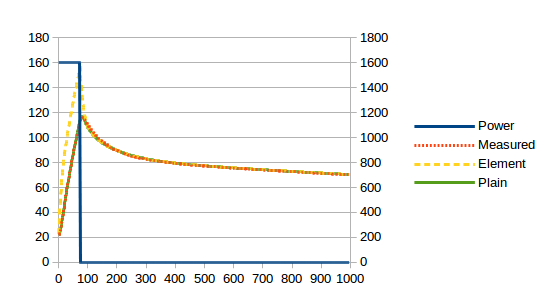
Looking good! There is still a fixed amount of energy to squirrel away somewhere: in the body presumably. And the asymptotes have different slopes. We’ll deal with the latter first. The asymptote is related to the loss to atmosphere which, given that by far the hottest external part of the machine is the brew head, I’ll model as a loss from the brew head to the atmosphere. We just need a heat transfer coefficient, but that’s easy: just tinker until the red and green lines end up parallel. It will turn out that 0.55 W/K is the magic number. Et voila:
Finally, the delta in temperatures between the red and green lines represents about 32kJ which, at about 80°C, represents a heat capacity of 395 J/K for the case. (The numbers I’m quoting now have been fine-tuned by tinkering. This is also how I got the 14 W/K heat transfer coefficient between element sides and plain sides of the boiler shell.) This is the complete model:
But does it work?
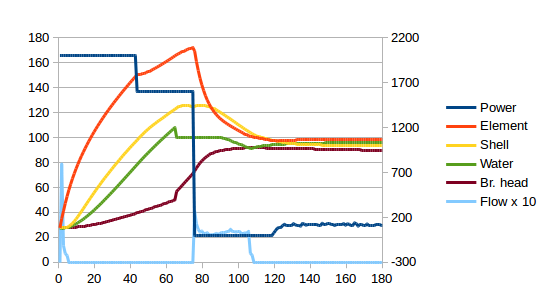
Does it work? Yes it does! Since the measured and modelled plain side temperature are now so close, I implemented the model but used the measured temperature in place of the modelled temperature. i.e. I used the red line instead of the green line. The P controller controls for total energy of boiler shell and water. Here is the result with my real-world Gaggia Baby Class going from cold to a dead-stable 95°C (this time I’ll throw in the water and brew head temperature curves):
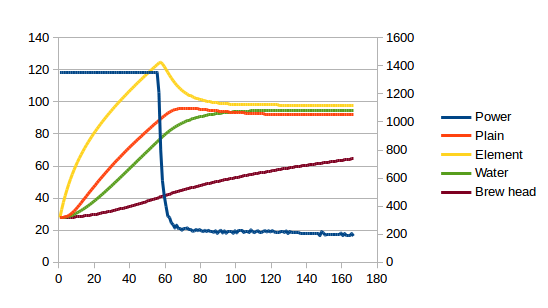
From cold to a dead stable 95°C in less than two minutes. And note, now when I talk about 95°C, I am talking about the water temperature. The previous PID controller was aiming for a stable boiler shell temperature. But we see from the graph above that water temperature will be slightly warmer than the measured shell temperature because there is no single temperature for the boiler shell – it is hotter on the sides with the elements.
So, much happiness here!
To summarise
Here are all the details of the controller in one place. First, the constants:
| symbol | value | unit | description |
|---|---|---|---|
 |
549 | J/K | heat capacity of boiler shell |
 |
422 | J/K | heat capacity of water |
 |
616 | J/K | heat capacity of brew head |
 |
395 | J/K | heat capacity of body |
 |
14.0 | W/K | heat transfer coefficient from element sides of boiler shell to plain sides |
 |
14.7 | W/K | heat transfer coefficient from boiler shell to water |
 |
3.6 | W/K | heat transfer coefficient from boiler shell to brew head |
 |
1.8 | W/K | heat transfer coefficient from boiler shell to machine body |
 |
0.55 | W/K | heat transfer coefficient from brew head to ambient air |
 |
95.0 | °C | target temperature |
The variables are:
| variable | unit | description |
|---|---|---|
 |
s | time between iterations |
") |
W | output power in step  |
") |
W | heat flow from element sides to plain sides in step |
") |
W | heat flow from element sides to water in step |
") |
W | heat flow from element sides to brew head in step |
") |
W | heat flow from element sides to body in step |
") |
W | heat flow from plain sides to water in step |
") |
W | heat flow from plain sides to brew head in step |
") |
W | heat flow from plain sides to body in step |
") |
W | heat flow from brew head to ambient air in step |
") |
°C | temperature of element sides in step |
") |
°C | temperature of plain sides in step |
") |
°C | temperature of water in step |
") |
°C | temperature of brew head in step |
") |
°C | temperature of body in step |
") |
°C | ambient air temperature in step (I used a constant) |
") |
J | energy error term for P controller in step |
On each control cycle iteration, the following calculations are made:
 = (T_{elm}(n) - T_{plain}(n)) . h_{elm,plain}")
 = (T_{elm}(n) - T_{water}(n)) . \dfrac{h_{boiler,water}}{2}")
 = (T_{elm}(n) - T_{bhead}(n)) . \dfrac{h_{boiler,bhead}}{2}")
 = (T_{elm}(n) - T_{body}(n)) . \dfrac{h_{boiler,body}}{2}")
 = (T_{plain}(n) - T_{water}(n)) . \dfrac{h_{boiler,water}}{2}")
 = (T_{plain}(n) - T_{bhead}(n)) . \dfrac{h_{boiler,bhead}}{2}")
 = (T_{plain}(n) - T_{body}(n)) . \dfrac{h_{boiler,body}}{2}")
 = (T_{bhead}(n) - T_{amb}(n)) . h_{bhead,amb}")
 = T_{elm}(n) + \dfrac{\Delta t . (P(n) - P_{elm,plain}(n) - P_{elm,water}(n) - P_{elm,bhead}(n) - P_{elm,body}(n))}{C_{boiler} / 2}")
 = T_{water}(n) + \dfrac{\Delta t . (P_{elm,water}(n) + P_{plain,water}(n))}{C_{water}}")
 = T_{bhead}(n) + \dfrac{\Delta t . (P_{elm,bhead}(n) + P_{plain,bhead}(n) - P_{bhead,amb}(n))}{C_{bhead}}")
 = T_{body}(n) + \dfrac{\Delta t . (P_{elm,body}(n) + P_{plain,body}(n))}{C_{body}}")
")
Finally…
 = (T_{target} - \frac{T_{elm}(n+1) + T_{plain}(n+1)}{2}) . C_{boiler} + (T_{target} - T_{water}(n+1)) . C_{water}")
 = \dfrac{e(n+1)}{\Delta t . 2}")
I used 
As for the P controller that’s it. But since we know how much energy is leaving the boiler + water system, one further refinement is possible: we can also add  + P_{elm,body}(n) + P_{plain,bhead}(n) + P_{plain,body}(n)")
")
 = \dfrac{e(n+1)}{\Delta t . 2} + P_{elm,bhead}(n) + P_{elm,body}(n) + P_{plain,bhead}(n) + P_{plain,body}(n)")
And a sneak preview
I have been also working on an algorithm to get the brew head up to temperature as fast as possible and have been mucking around with increased boiler power. As of today, this is the best I have done7Also visible below, I model power lost to water flow and to latent heat of vaporisation when generating steam. Another topic for another day!:
 160s from switch-on until the water and brew head are ready for the perfect shot. For the first 110s, I am measuring and grinding the beans and filling the milk jug. After that, the portafilter is hot and can be removed for dosing and tamping. It’s getting to the point that the machine will be ready before I am, which is what I want. There’s more scope for play, but I’ll take it one step at a time, making sure nothing is melting before pushing the envelope further.
| ↑1 | That’s not quite all that is needed – the brew head needs bringing up to temperature as well. But that’s a different topic and I’m still working on it. Two minutes is also not an absolute minimum because the boiler power can be increased. Also a topic for another day. For the purposes of this post, we’ll use the stock 1350W the machine shipped with. |
|---|---|
| ↑2 | Bother! Having slaved over this graph, I now notice I used 1600W and I had promised to stay at 1350W. I can, however, assure you that the same latency occurs with the stock boiler. |
| ↑3 | In the interests of clarity, the two graphs below are taken from simulations rather than a real coffee machine. This allows me to simplify the presentation by removing effects that are not germane to the present conversation. |
| ↑4 | The smooth tailing-off of the power between 60s and 100s is caused by power loss to other components of the system which are still warming up rather than the controller approaching the target power slowly. |
| ↑5 | How hot would the boiler need to get to explode? Well, we know it can handle at least the 15 bar the pump generates, so (quickly checking steam tables) you’d need well over 200°C. The silicone O-ring will still be safe at this temperature but the thermal fuse ought to have blown. Still, I think, for the sake of rhetoric, we can count a blown fuse as a small explosion! |
| ↑6 | By any measurable amount anyway! |
| ↑7 | Also visible below, I model power lost to water flow and to latent heat of vaporisation when generating steam. Another topic for another day! |
This is absolutely amazing work, I love it.
Now tell me – how do I calculate/measure the constants for other machines? 🙂
A lot of it I did by writing specific calibration code. Some of my calibration logic is in the source code I published here.
I’d have to go back and look at that code for details and, anyway, some of the code might have been changed later. But, for example, if you want to know the heat transfer to ambient you just need to apply a specific power level for a long time and then measure the asymptotic temperature, subtract ambient and divide the result by the power level.
PS sorry for taking so long to reply. I rebuilt my web server some time ago and obviously did not get me e-mail notifications working properly.
Amazing work.
Let’s say you also have a flow meter and a temperature sensor in the water tank, do you think it is possible, using additional sensors, to improve the model for better intra-shot temperature stability?
What about putting a temp sensor inside the boiler itself to measure hot water temperature directly?
I find, actually, when I measure the temperature of the water coming out of the brewhead it is pretty much exactly the modeled temperature for the brewhead. i.e. 1) the water temperature in the boiler is not that important because it changes as it passes through the brewhead and 2) the model accurately predicts the brewhead temperature so no additional temperature probe is needed.
I have been pondering whether I could improve the control so that an intra-shot temperature profile could be followed. I have heard that some of the top professional machines do this.
Hi Tom. This is really impressive work!
I’m wondering whether this could be simplified a bit by having different control algorithms for different stages? Eg a power up heating stage to heat the boiler at 100% power, as high as steaming temp if necessary, to bring the brew head up to temp as quickly as possible; PID control to maintain brew head temp between shots; and shot heating based on energy needed to heat the incoming water. The heat up cycle could just be a simple timer, based on empirical measurements. If the boiler needs to be cooled once the brew head is at temp then an automatic flush could be added.
Do you think this approach would work?
Steve
I do something like this. I model it as a state machine. State changes occur when certain conditions are met (e.g. being up to temperature). In each state, the solenoid, temperature setpoint and flow rate setpoint are set according to what that state does. In the background all the time, the temperature and flow controller algorithms just keep aiming at these various setpoints. Latest source code is here and that’s probably the best place to look. (In the main loop() function in coffeepid.ino.)
Hey Tom! This is pretty awesome stuff!
I own a Gaggia Classic (pre-2015 model) which should be similar to your baby, and I have heavily modded it over the years. I am running a raspberry pi with a tsic306 digital sensor for temperature measurements, similar to you I also measure flow, pressure, modulate pump pressure etc. I have been running with a PID algorithm for a while with decent success, but I just had to tinker with your sweetly engineered approach when I came across it. So I adapted your temperature controller to my project, and ran my simulation rig generating similar graphs like you have. Great success!
Though my temperature sensor is positioned in the original position, secured with a copper screw. So I would assume, given the original position being on the element side, it would be more correct to update the elementTemp rather than the shellTemp?
I noticed you calculate both shellTemp and elementTemp, amongst a multitude of other variables like “desiredAverageShellTemp” to get the error and power, while measuring and then overwrite the shellTemp with the measured temperature.
I tried instead updating the elementTemp, but suffered a graph with 100% boiler power in the start, reaching 95 deg water temp and dropping to 0% power for a while – then triggering choppy power measuring temp up and down between 95 and 98 degrees, not getting the direct smooth continuous maintenance power. I would assume I would need to adapt the calculations somewhere, so I was wondering if you had any suggestions to cater for this?
If I measure the temp (from my original position sensor) and update the shellTemp, on the other hand, I do get similar results going straight to decent maintenance power – but I naturally then assume the water and element values would be wrong.
Or would it be better to just move my temperature sensor? Pretty happy with my mounting work though 🙂
Hi Hans. Thanks for the great feedback. I love finding fellow coffee machine modders.
The short answer is probably that updating shellTemp will work well and be close enough even if it isn’t actually right. Several things make me think this…
First, I now have a better way of mounting my temperature probe on she shell side and it turns out that a lot of my measurement latency was due to how I mounted the probe rather than how long it takes shellTemp to increase. i.e. the element to shell heat transfer coefficient is actually higher than the 14W/K I model. With the lower latency sensor mounting I have found that the machine still behaves very well without updating the firmware.
Second, I have attempted to port this algorithm to my 3D printer extruder but get a lot of oscillations. The difference between the coffee machine and the extruder is that the extruder doesn’t have a convenient large second thermal mass for which I can just override the modeled temperature with measured temperature. I now suspect that this is the main thing that makes this algorithm work so well on the coffee machine and I am also guessing that if the measured value has lower latency than the modeled value then the algorithm will be stable and the temperatures will only be incorrect for a short time when responding to step input changes (e.g. when switching the machine on). I think that by updating elementTemp you are essentially doing the same thing as I am attempting on the 3D printer extruder and getting similar results.
Finally, I suspect your temperature sensor has more latency than the modeled temperature for elementTemp. This would makes sense to me because, first, the temperature probe point is a chunk of aluminum which has higher thermal inertia than the surrounding element wall and, second, I suspect the T092 casing of the tsic306 makes it hard to mount with a really high heat transfer coefficient. I would be very interested to see a graph of your measured temperature’s response to a step power input. i.e. your equivalent of this: .
.
Thanks for the swift and detailed response, really appreciated!
Interesting, I’ll keep that in mind and tinker a bit with the shellTemp. I guess it could be a simple hack to offset the brew setpoint to reduce any shellTemp vs waterTemp error? I’ll try to run with the shellTemp approach and see how it behaves in the cup.
Right, seems like a similar case like your 3d-printer. I just ran a test to 110C on my machine and it gave me a rough latency of ~6.55sec from toggling the boiler to the first decreasing measurement. Would be interesting to hear precisely what latency you are able to achieve with your tweaks for comparison, and if you get any additional ideas based on these values. Graph: https://i.imgur.com/XXJOcPL.png
Btw I came across this project recently that you might find interesting, if you haven’t seen it already: https://github.com/Zer0-bit/gaggiuino
Yep, the 6.55s latency will be why you’re getting oscillations with elementTemp.
Nicely graphed. What did you use to plot it? (I have been copying and pasting into LibreOffice Calc and generating a graph from there. It’s time consuming.)
You may be interested in this post where I explored different mounting points for temperature probes. Rereading that post I see I included a spreadsheet with all the data. (I had totally forgotten about that and am now super impressed!) According to that data I am getting a latency of around 3 to 4 seconds with my present probes.
Regarding the error in water temperature, yes I think there will be a small fixed offset. You can see this in my last graph above where element, shell and water temperatures all settle at a slightly different level. But as you observe, it’s really a question not of the exact temperature but how it behaves in the cup. Find the setpoint that does it for you. (This is easy practical advice to give. In truth I personally would be very tempted to carry on tinkering trying to get an algorithm that gives the real temperature!)
Some day I must crack the more general problem which the 3D printer represents and then I will also have solved the problem of controlling from the Gaggia brew thermostat mounting point.
I had not seen gagguino before. It looks beautifully documented.
Nice, I see now that there is more to explore on your blog than I already found – great stuff! I just found this through the “coffee features” overview. Will definitely have a look at that, and all the other posts (ok, I read some now – already thinking of adding thermal paste on the brew head). I was inspired by James’ Espiresso project and therefore went for the tsic sensor, but plastic is naturally not the best conductor so will have to live with that for now. Will for sure use your explorations as reference if (or when) I feel like revamping the sensors.
I plotted the graph using matplotlib in python using a little code to parse the log file I generated – will whip over a snippet on email.
Hehe, practical tip for sure and obviously the goal – but got to enjoy the tinkering journey too. Would be interesting to see if you manage to model for more applications like the 3d-printer, make sure to blog about it if you do!
I think all my blog posts about the coffee machine are linked in somewhere, especially in the list on the Pimping my coffee machine page. They are definitely all listed in my Coffee curry and cocktails category which majors on the coffee and is probably a big disappointment to lovers of curry and cocktails.
PS Further thought on temperatures: it’s not really the water temperature that is critical. It’s the brewhead temp. I have found when measuring water out of my brewhead that my modeled brewhead temp is the same as the water I get out.
Oh Hans, I think I’ve done it! Push request for Marlin 3D printer firmware here. I’ll get round to adapting it to the coffee machine at some point but if the Marlin code changes make any sense to you you might get there first. The key stuff is around the modeling of sensor_heat_capacity, sensor_xfer_coeff and modeled_sensor_temp. To some degree modeled_ambient_temp is of value but it’s really the sensor modelling which gives delta_to_apply which is the magic bullet.